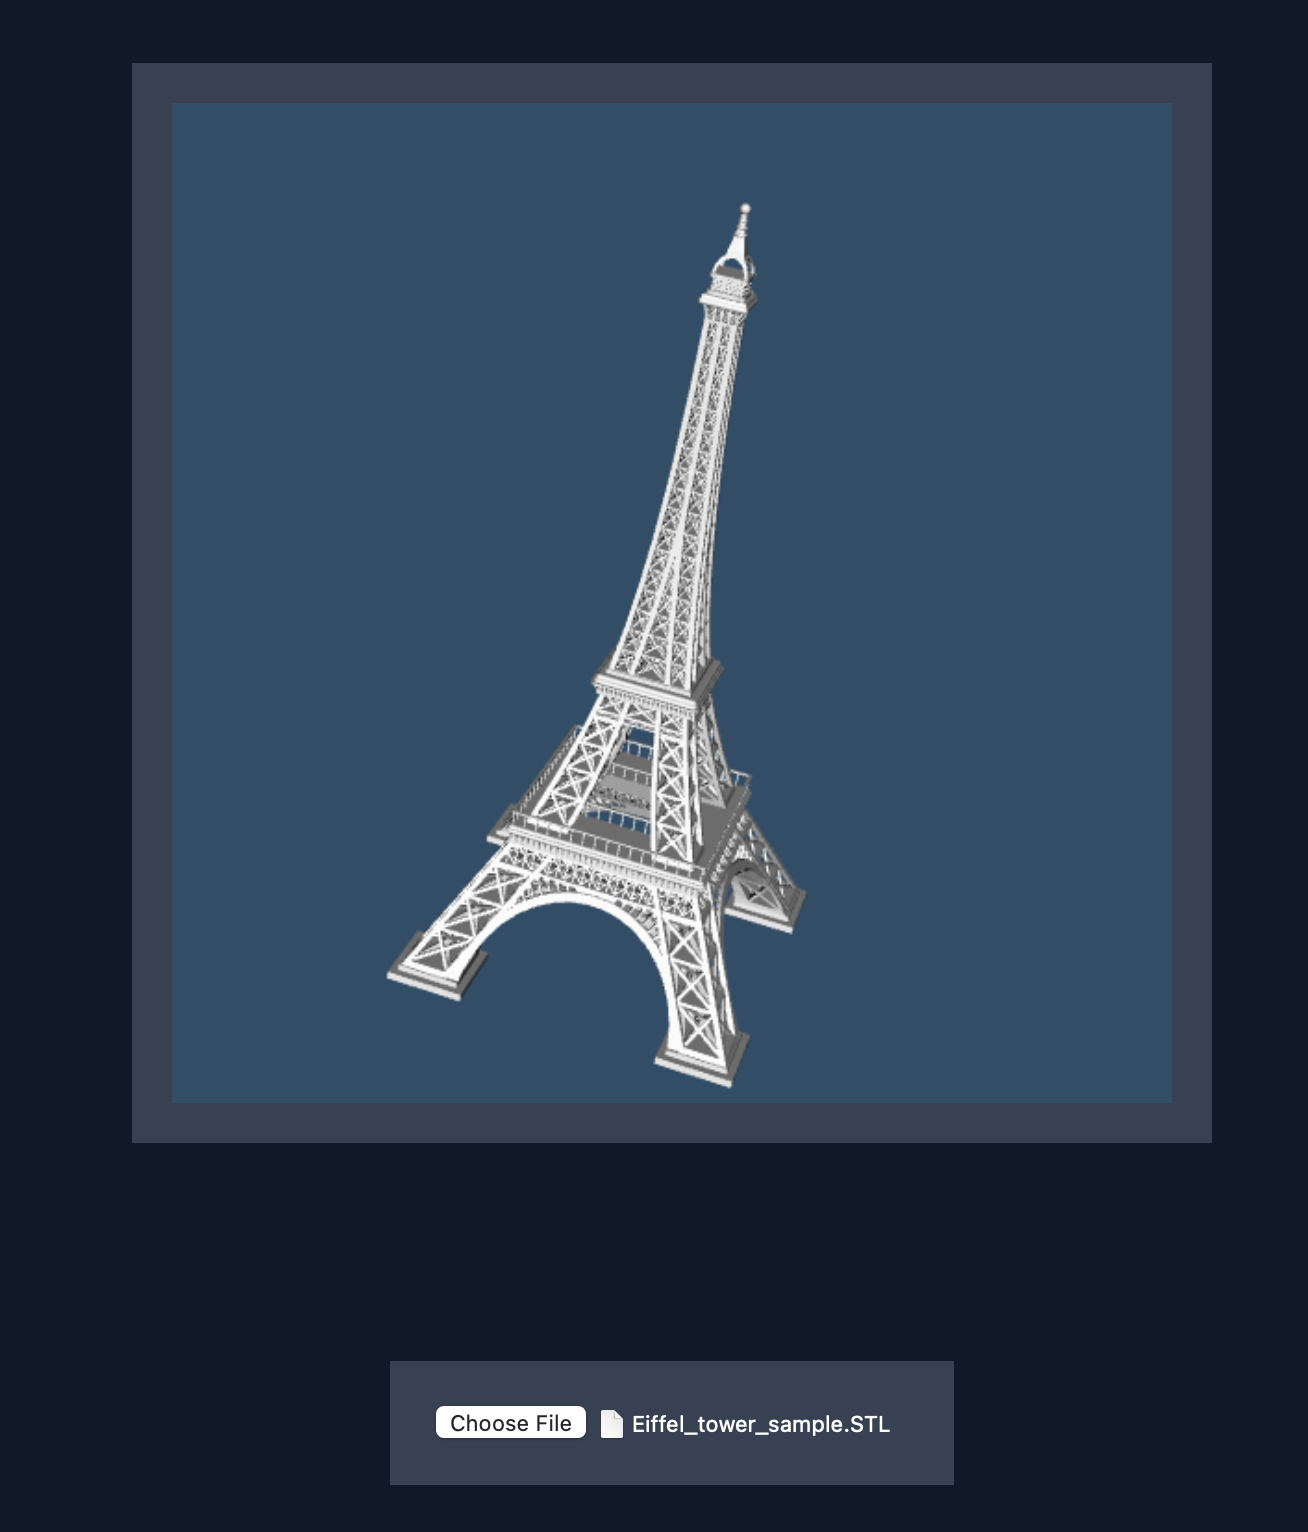
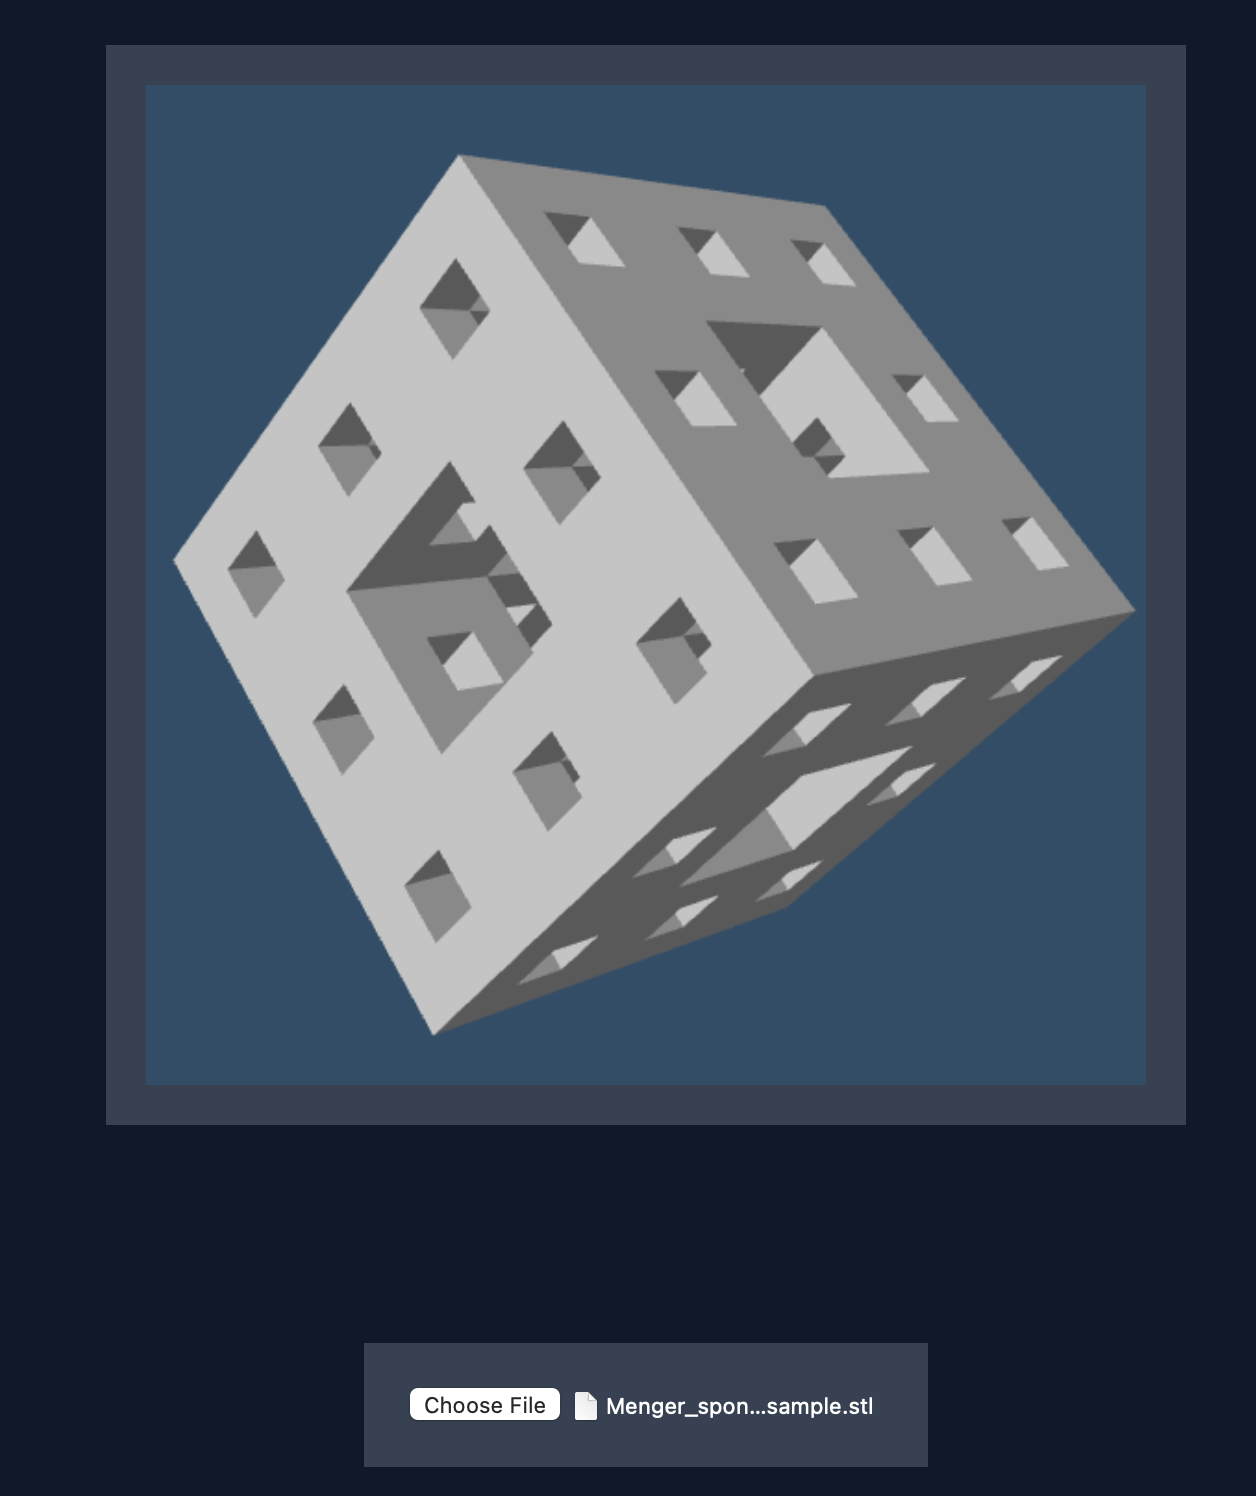
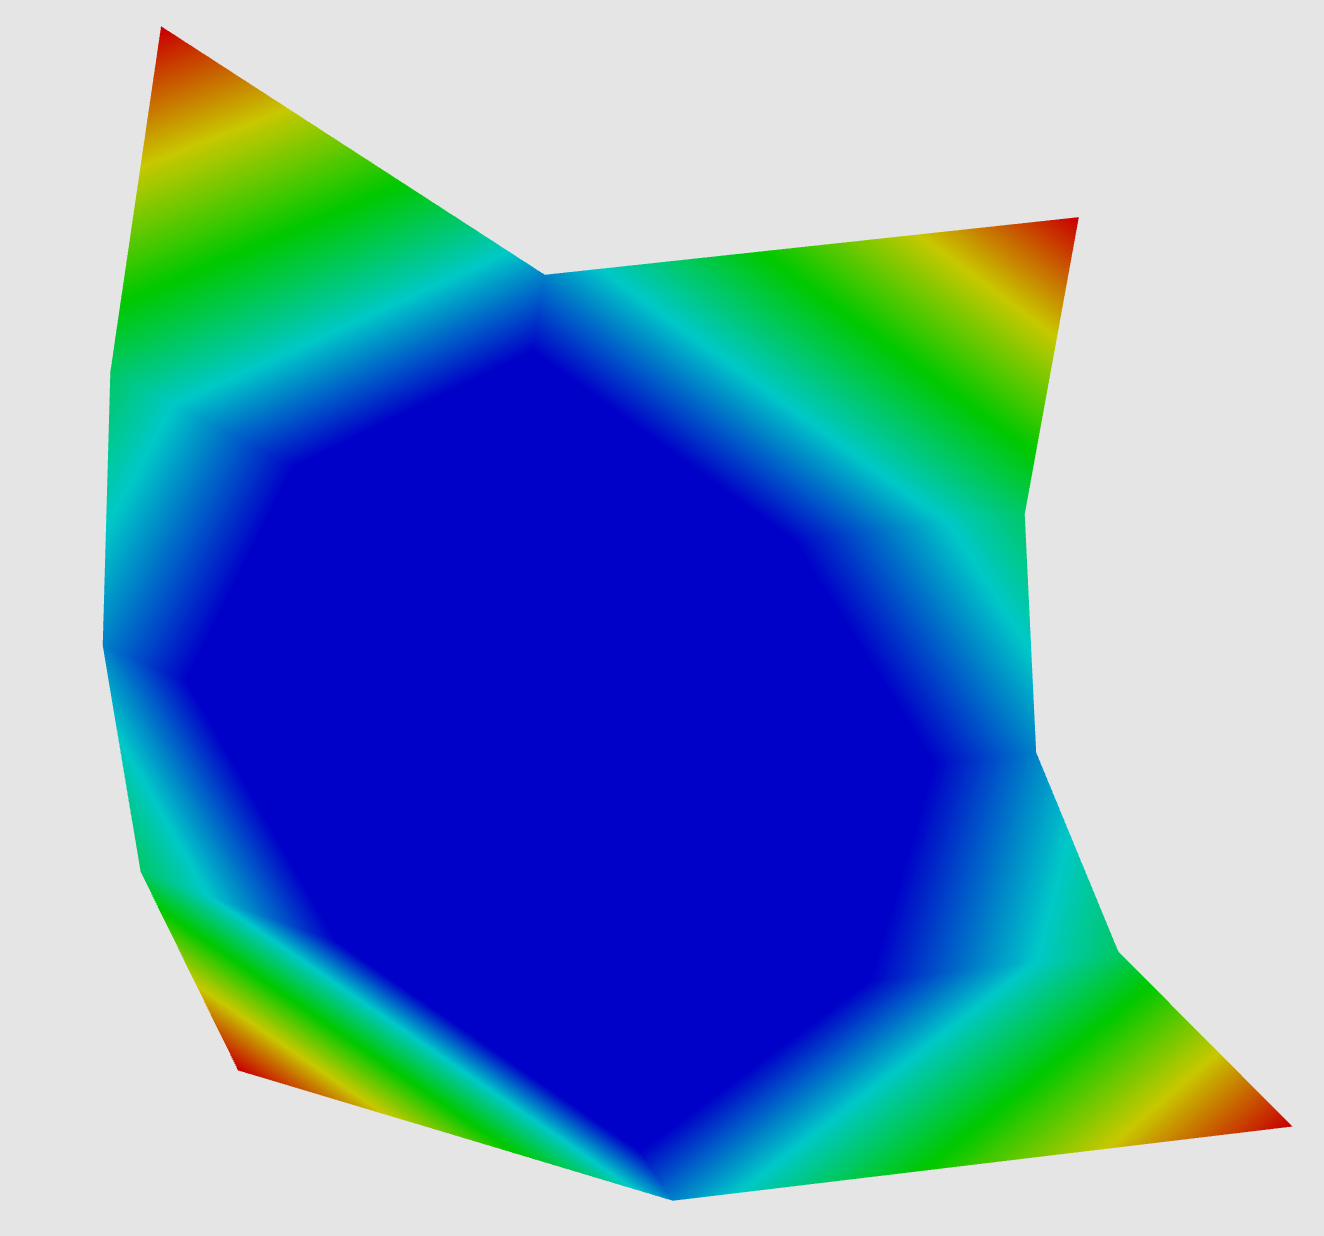
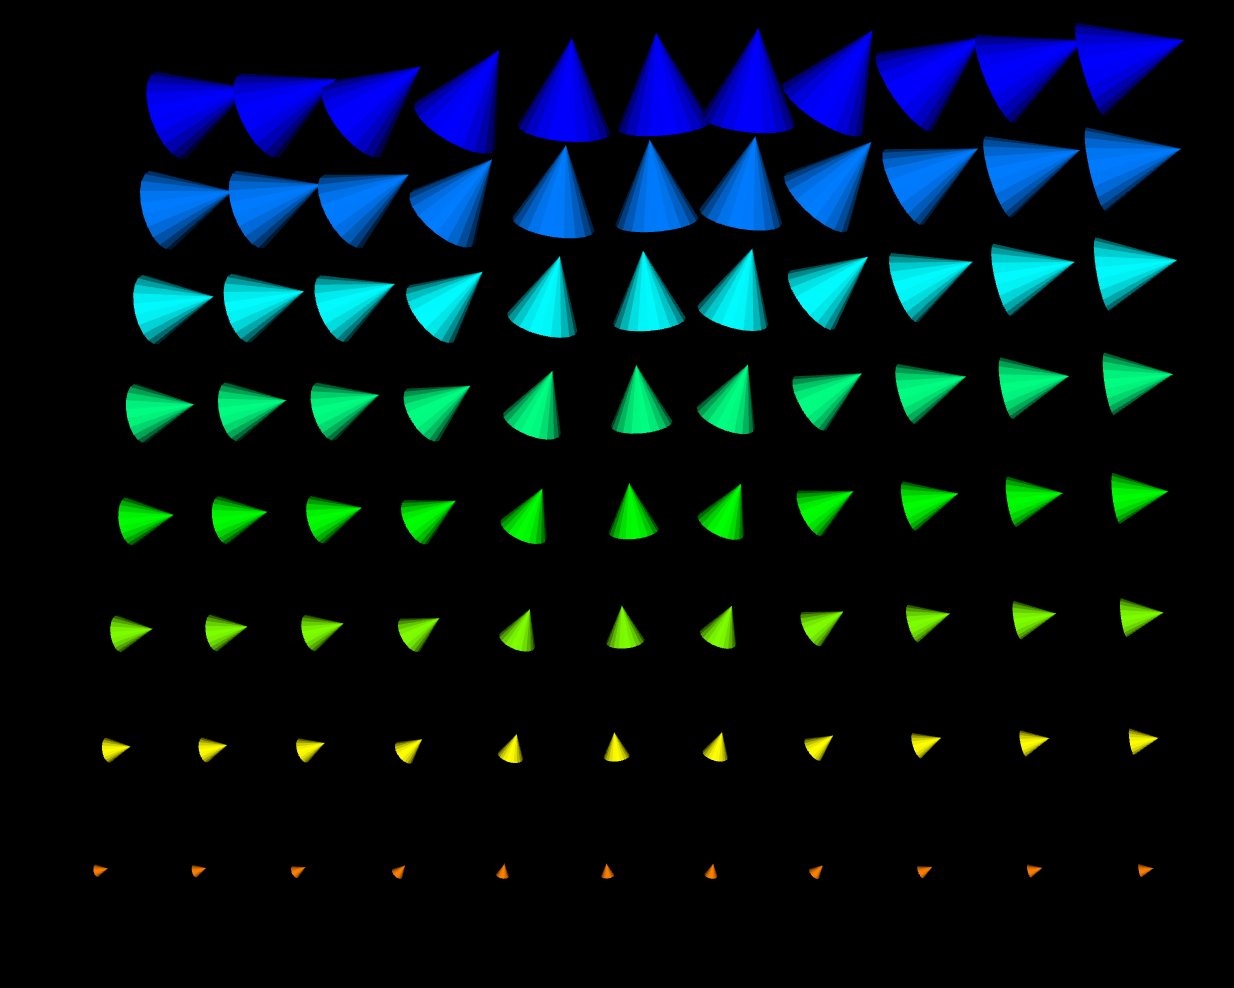
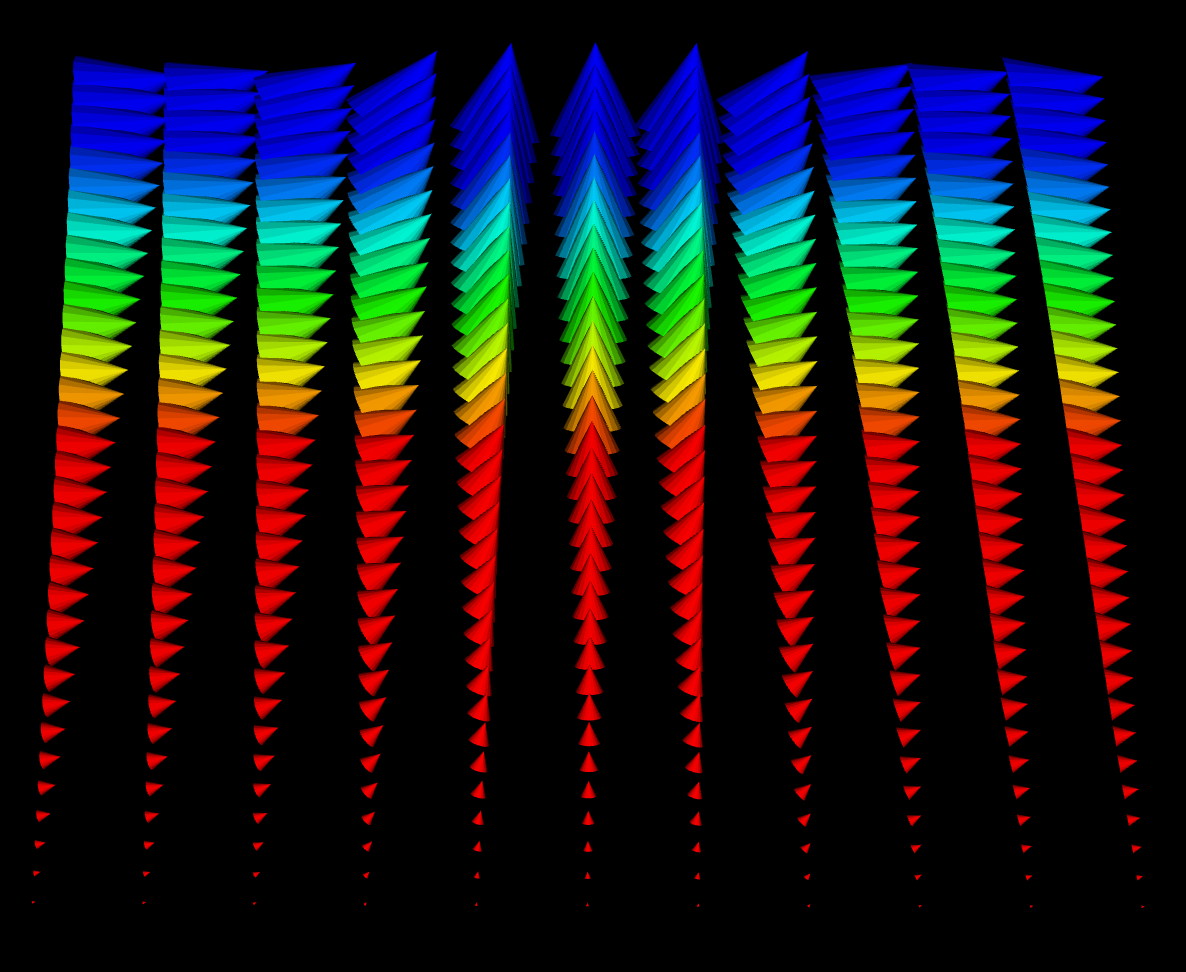
Team 7 is implementing a web widget that will automatically connect to the server when launched and allow the user to select files through the web widget so the user can easily juxtapose different data files as well as utilize all utilities of their current data visualization methods. The utilities include creating color maps, vectors, and Glyphs and being able to rotate the 3D visualization of this data.